# Surviving a 100% CPU Database Meltdown in Open WebUI - Fixing a Hidden Full Table Scan
Table of Contents
We host a beta version of an open-source tool called Open WebUI at an enterprise scale. We have over 1,000 daily users, hitting 500+ concurrent users at peak times.
Recently, I was pressured by the business side to upgrade to a newer version.
As I always say, there are some production issues that are simply too costly or impossible to catch in DEV/UAT environments. This was one of them.
A day or two after the upgrade, our production PostgreSQL database was suddenly pinned at 100% CPU.
All actions on the web UI became randomly sluggish with wildly inconsistent loading times.
Because we have a managed Postgres instance, I checked the query insights on our portal.
I found this query taking an estimated 1-2 hours to execute:
SELECT public.file.id, public.file.user_id, ... FROM public.file WHERECAST(((meta -> $1) ->> $2) AS VARCHAR) = $3 AND CAST((data->> $4) AS VARCHAR) IN ($5,$6) AND id NOT IN (SELECT file_id FROMknowledge_file WHERE knowledge_id = $7)This perfectly matched an active GitHub Issue (#25717). Long story short: there is a specific endpoint that triggers a knowledge-management query, resulting in a massive full table scan on unstructured JSON columns.
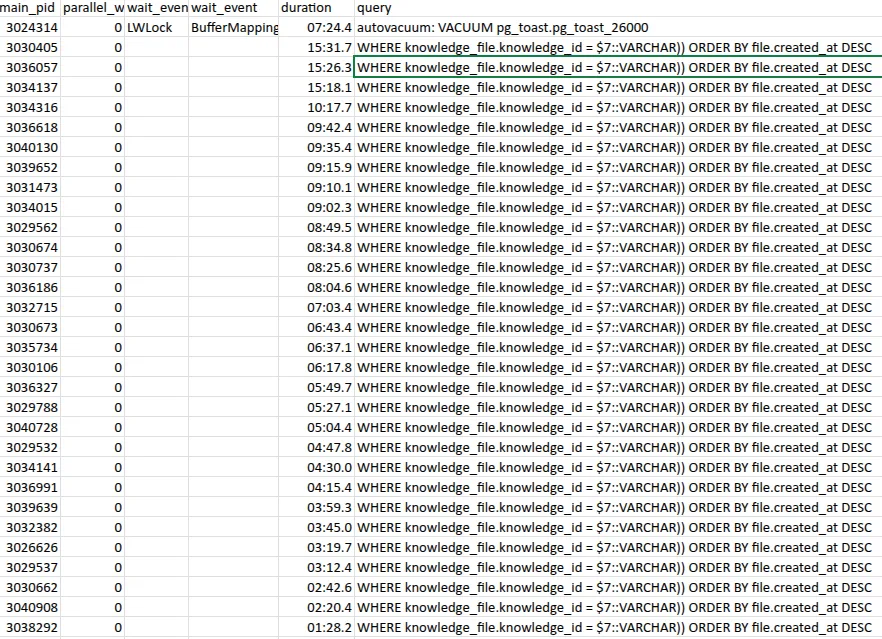
I ran a query to check for active, blocking queries:
SELECT coalesce(leader_pid, pid) AS main_pid, COUNT(pid) - 1 AS parallel_workers_hijacked, wait_event_type, wait_event, age(clock_timestamp(), MIN(query_start)) AS duration, queryFROM pg_stat_activityWHERE state = 'active' AND pid <> pg_backend_pid()GROUP BY coalesce(leader_pid, pid), wait_event_type, wait_event, queryORDER BY COUNT(pid) DESC, duration DESC;The results confirmed that multiple instances of that exact SELECT file.id… query were actively spinning our CPU up to 100%.
Here is my step-by-step action plan to survive the spike and permanently fix the bug.
1. Kill all stuck queries
To get immediate relief, I terminated the blocking backends:
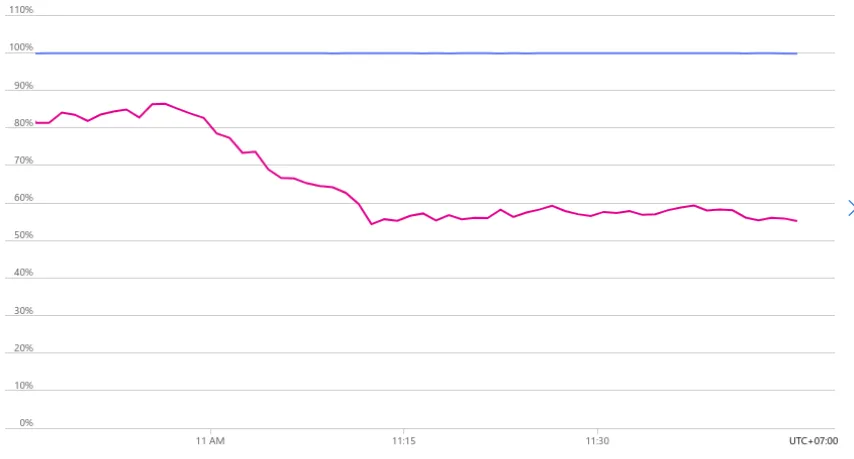
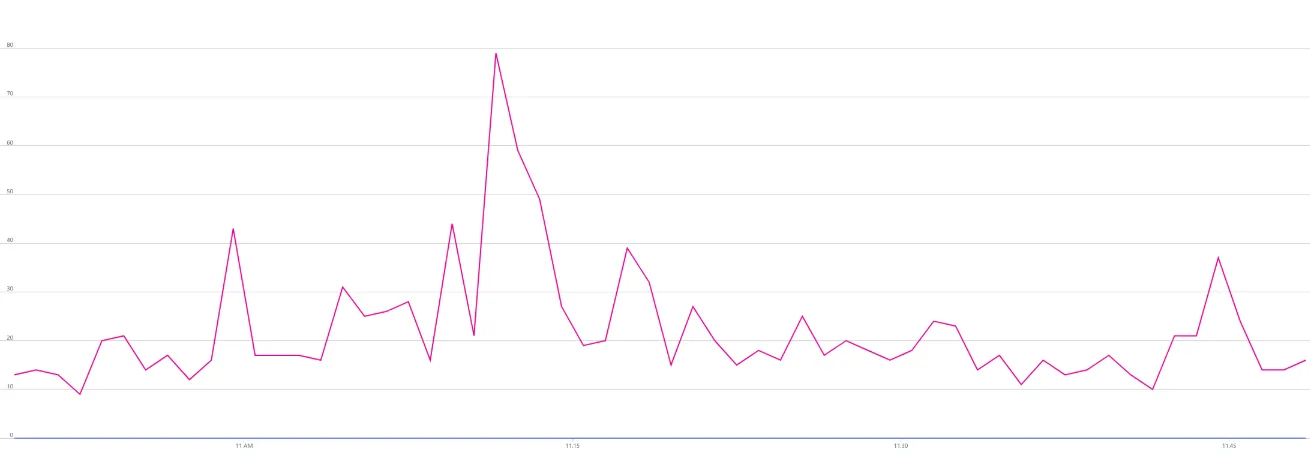
SELECT pg_terminate_backend(pid)FROM pg_stat_activityWHERE query ILIKE '%SELECT file.id, file.user_id%' AND query ILIKE '%status%' AND state = 'active' AND age(clock_timestamp(), query_start) > interval '5 minutes';With monitoring, I confirmed the CPU immediately dropped from 100% to normal levels. That proved these specific query processes were the culprit.
From
 To
To
2. Create a pg_cron to actively eliminate this query
To keep the database alive while I worked on a permanent fix, I scheduled a cron job to actively eliminate this query if it hung for more than 1 minute:
SELECT cron.schedule( 'kill-stuck-openwebui-queries', '*/2 * * * *', $$ SELECT count(pg_terminate_backend(pid)) FROM pg_stat_activity WHERE query ILIKE '%SELECT file.id, file.user_id%' AND query ILIKE '%status%' AND state = 'active' AND pid <> pg_backend_pid() -- Never kill the job itself AND age(clock_timestamp(), query_start) > interval '1 minute'; $$);3. Create Index for file table
The query was bottlenecking because it was searching inside JSON blobs without an index. I started by indexing just the knowledge_id:
CREATE INDEX CONCURRENTLY idx_file_pending_knowledgeON public.file (((meta->'data'->>'knowledge_id')::uuid))WHERE (data->>'status') IN ('pending','processing');I tested it with an EXPLAIN (ANALYZE, BUFFERS) using a real UUID :
EXPLAIN (ANALYZE, BUFFERS)SELECT id FROM public.fileWHERE (meta->'data'->>'knowledge_id') = '<-------UUID------->' AND (data->>'status') = 'pending';The result was still far too slow (about 40 seconds)
Bitmap Heap Scan on file (cost=6.39..6740.81 rows=11 width=37) (actual time=40697.806..40697.807 rows=0 loops=1) Recheck Cond: ((data ->> 'status'::text) = ANY ('{pending,processing}'::text[])) Filter: (((data ->> 'status'::text) = 'pending'::text) AND (((meta -> 'data'::text) ->> 'knowledge_id'::text) = '<-------UUID------->'::text)) Rows Removed by Filter: 448 Heap Blocks: exact=472 Buffers: shared hit=895 read=124287 I/O Timings: shared read=6494.249 -> Bitmap Index Scan on idx_file_pending_knowledge (cost=0.00..6.39 rows=4386 width=0) (actual time=0.213..0.214 rows=963 loops=1) Buffers: shared hit=1Planning: Buffers: shared hit=194Planning Time: 1.151 msExecution Time:** 40697.900 ms**Notice the 124287 disk reads. The database still had to load massive amounts of data into memory just to filter the status.
4. The Kill Shot: The Composite Partial Index
CREATE INDEX CONCURRENTLY idx_file_pending_knowledge_compositeON public.file ( (data->>'status'), ((meta->'data'->>'knowledge_id'))) WHERE (data->>'status') IN ('pending', 'processing');The result was instantly a game-changer. The execution time dropped to 0.064ms.
Index Scan using idx_file_pending_knowledge_composite on file (cost=0.15..24.37 rows=11 width=37) (actual time=0.013..0.013 rows=0 loops=1) Index Cond: (((data ->> 'status'::text) = 'pending'::text) AND (((meta -> 'data'::text) ->> 'knowledge_id'::text) = '<-------UUID------->'::text)) Buffers: shared hit=1Planning: Buffers: shared hit=17Planning Time: 0.359 msExecution Time: **0.064 ms**The End Result
The application is now highly responsive again, and the database CPU is normal again.
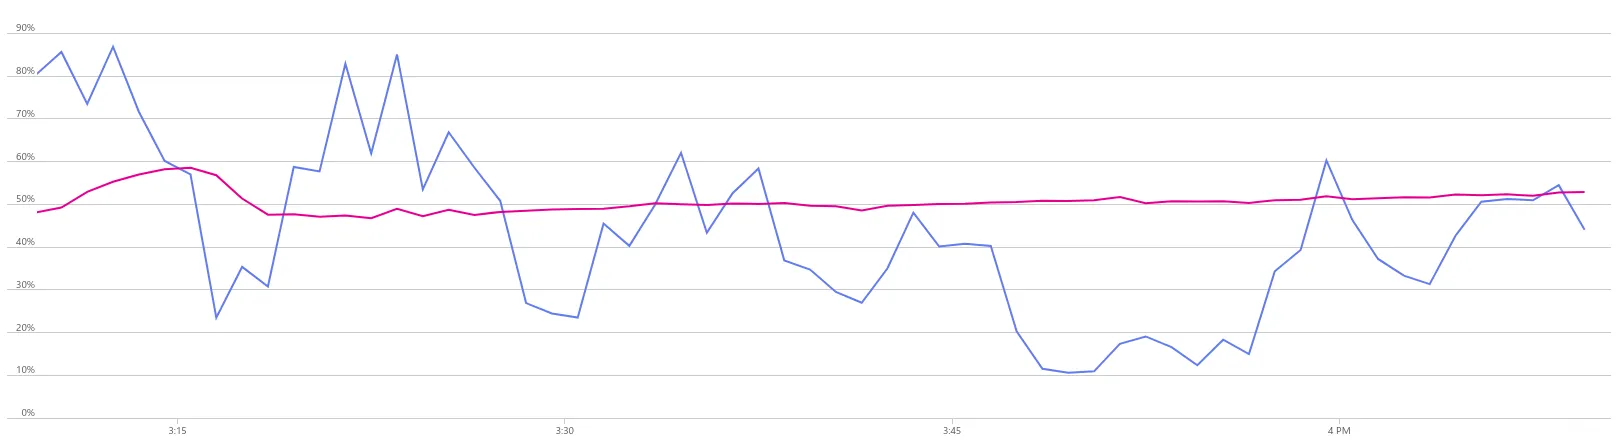
While this composite index permanently solved the issue, I still consider this a symptom of a larger problem. When you run beta, open-source software, you have to be prepared for unoptimized queries. However, a blind spot this large indicates that their test suite—despite any claims of being “enterprise-ready” is clearly not being tested against datasets that resemble real-world production scale.
A full table scan on unstructured JSON might slip by silently when testing with 50 documents on a developer’s laptop, but it will bring a server to its knees the moment you hit a real user load.
Open WebUI is a powerful tool, but incidents like this lower my inherent trust in their database architecture. If you’re running it in production, be prepared to get your hands dirty and self-patch.